The article shows how to setup a PHP IDE for step-by-step debugging. The setup was examined for the PhpStorm IDE and Eclipse PHP IDE.
About PHP IDE
An Integrated Development Environment, or IDE, is a self-contained application that lets you write, compile, execute, and debug code all in one place. Also, an IDE typically employs a single language and includes the language’s compiler/interpreter and debugger.
Top IDE for PHP Projects are:
We will review two of them: PhpStorm and Eclipse PHP IDE. The author of the article has experience to setup NetBeans debugging, so, we can add it in the future.
PhpStorm is a commercial product which supports major frameworks: Symfony, Laravel, Drupal, WordPress, Zend Framework, Magento, Joomla, CakePHP, etc. It includes all the PHP tools such as: code completion, refactorings, on-the-fly error prevention, etc.
PhpStorm is truly perfect IDE, but it is commercial as mentioned above. But if you want anyway install PhpStorm, click the link.
The Eclipse PHP IDE project delivers a PHP Integrated Development Environment framework for the Eclipse platform. Basically, this project includes all of the development components required to create PHP-based web applications with ease of extension.
To install the The Eclipse PHP IDE follow the link.
Eclipse PHP IDE Setup for Step By Step Debugging
The settings examined in the environment consisted of the following components:
- Eclipse PHP IDE Version: 2021-06 (4.20.0)
- PHP 7.4
- PHPUnit 9.2
- php_xdebug-3.0.3-7.4-vc15-x86_64.dll
Firstly, for proper debugging (debug step by step, show variable values) with xdebug, make these settings in php.ini:
[XDebug]

zend_extension="php_xdebug-3.0.3-7.4-vc15-x86_64.dll"
xdebug.mode=develop
xdebug.mode = debug
xdebug.start_with_request=trigger
Then make these settings in Eclipse PHP IDE:
- Go to Windows > Preferences
- Select PHP > Installed PHPs
- Select installed PHP and click on the button Edit…
- Make appropriate settings in the dialog window
In the tab Debugger make settings:
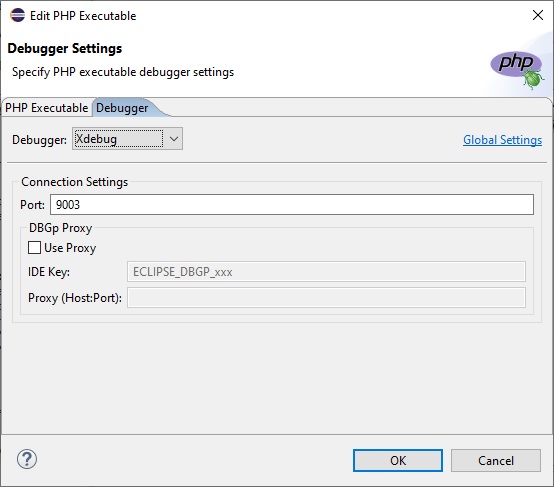
- Confirm settings
- Select PHP > Debug and make settings:
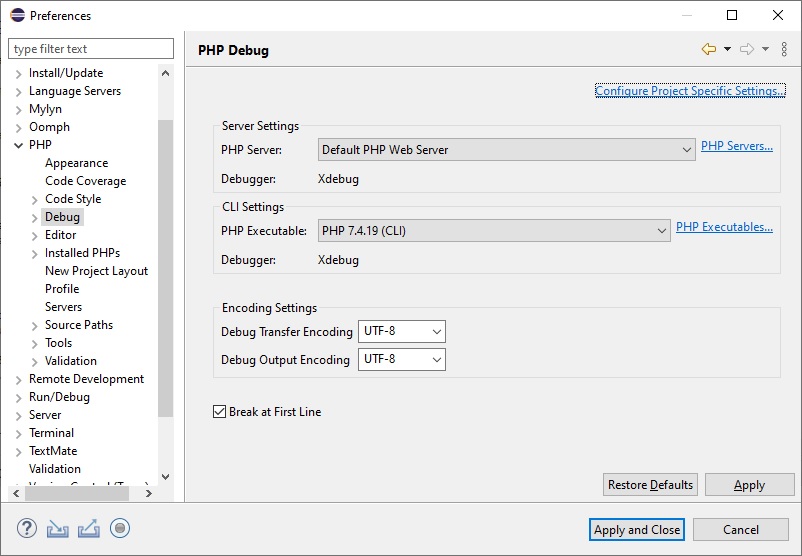
Re-launch the Eclipse PHP IDE application.
PhpStorm Setup for Step By Step Debugging
The settings examined in the environment comprising following components:
- PhpStorm 2021.1.3
- PHP 7.4
- PHPUnit 9.2
- php_xdebug-3.0.3-7.4-vc15-x86_64.dll
Firstly, for proper debugging (debug step by step, show variable values) with xdebug, make these settings in php.ini:
[XDebug]

zend_extension="php_xdebug-3.0.3-7.4-vc15-x86_64.dll"
xdebug.mode=develop
xdebug.mode = debug
xdebug.start_with_request=trigger
Select the menu item File > Settings, and after that click on the menu item PHP > Composer:
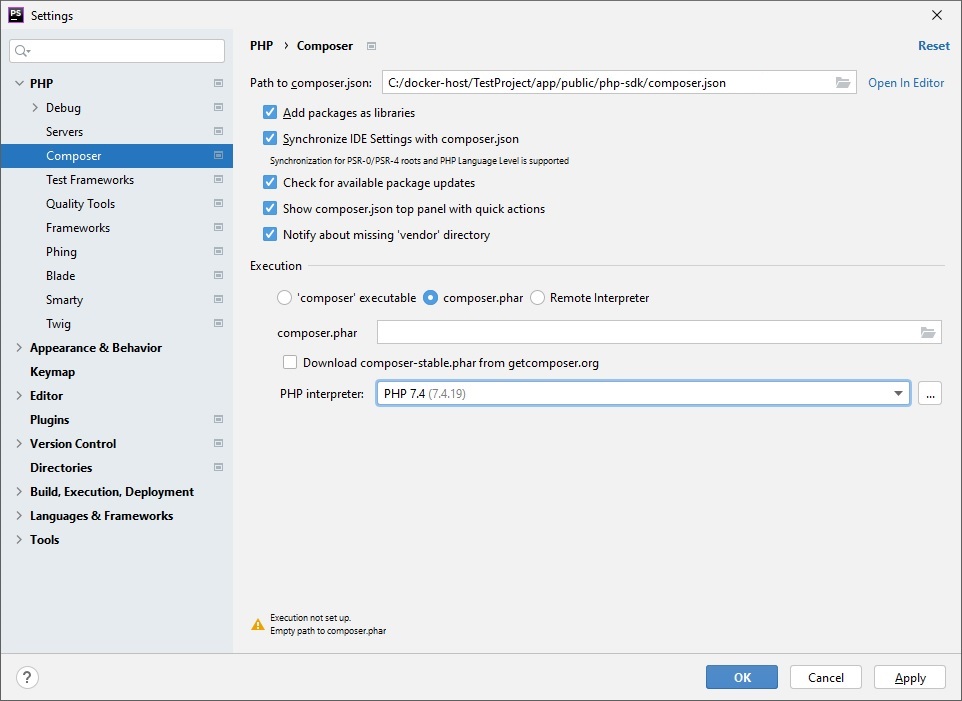
The field “PHP interpreter” is required for setting.
You should indicate the CLI interpreter also in the dialog form opened after clicking on the root menu item PHP:
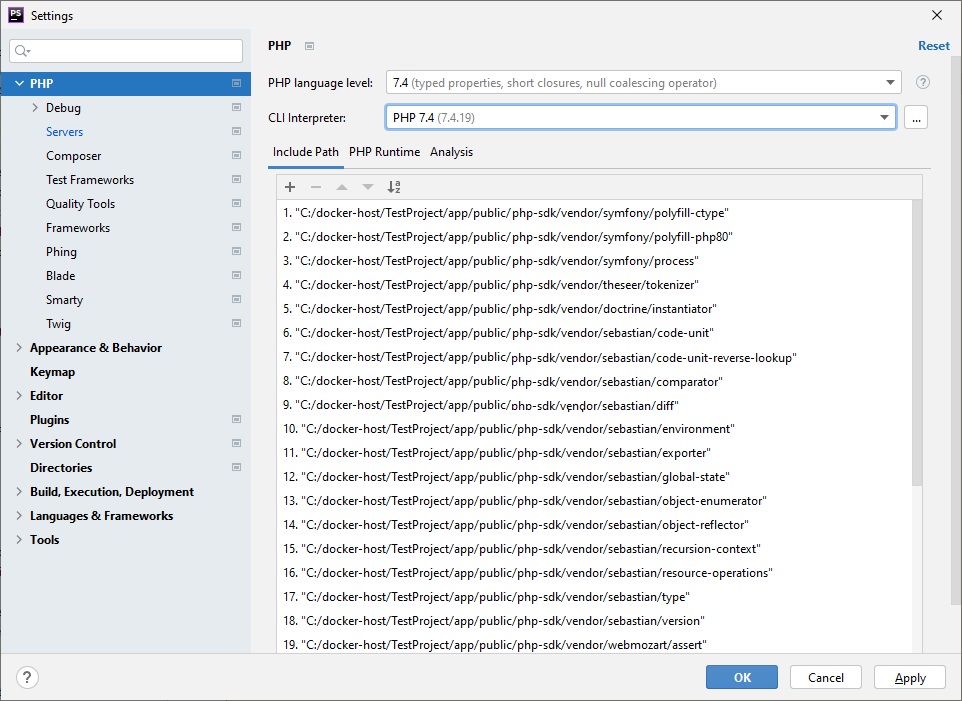
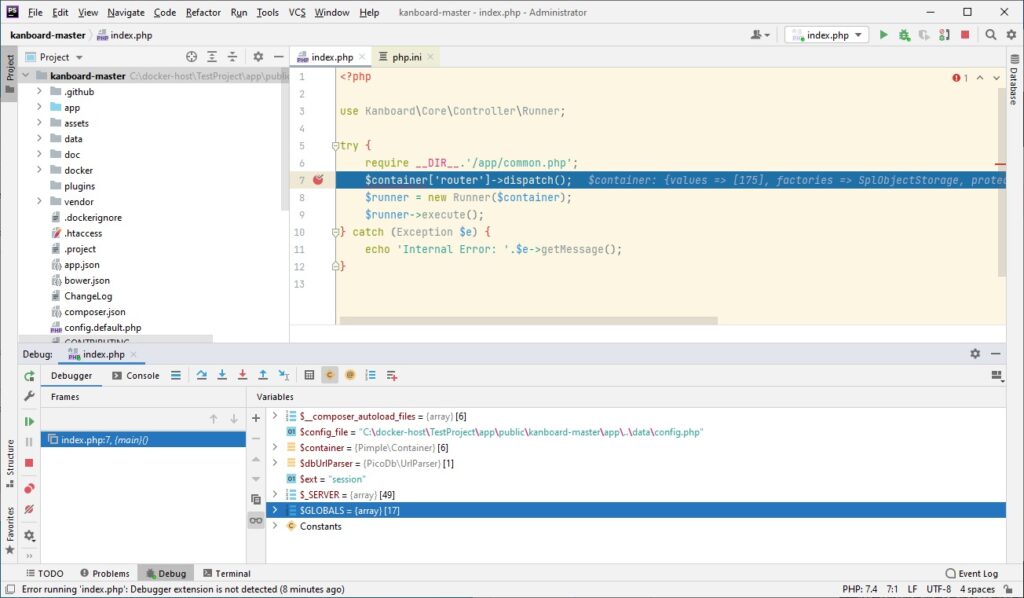
After that you can run debug process:
Was this helpful?
2 / 0
Very helpful article. Thanks.